

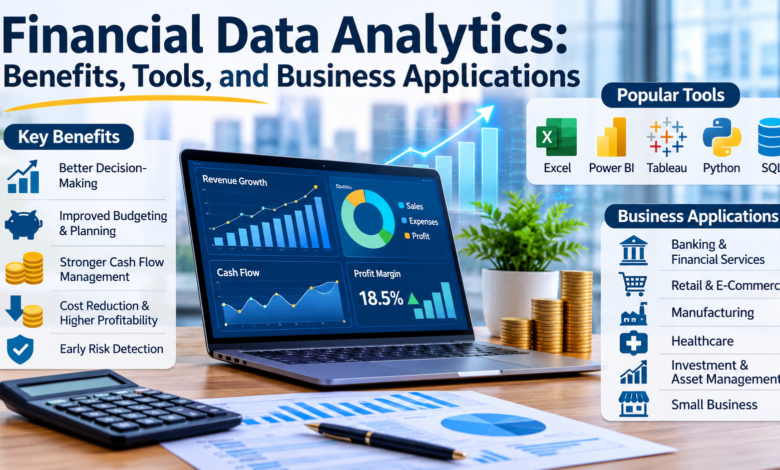
Financial data analytics is changing how businesses manage money, evaluate performance, control costs, and make important decisions. Instead of relying only on spreadsheets, historical reports, or manual calculations, organizations can use financial data to understand what is happening in their operations and identify what may happen next.
For businesses of all sizes, financial information is one of the most valuable resources. Sales figures, operating expenses, cash flow, customer payments, investments, and budgets all provide insights into the financial health of an organization. However, collecting this information is not enough. Businesses need effective ways to organize, analyze, and interpret it.
This is where financial data analytics becomes important. It combines financial knowledge, analytical methods, and technology to turn raw financial information into useful business insights. Whether a company wants to improve profitability, prepare accurate budgets, identify financial risks, or plan future investments, analytics can support better decisions.
This guide explains what financial data analytics means, how it works, its major benefits, the tools businesses use, and its practical applications across different industries.
What Is Financial Data Analytics?
Financial data analytics is the process of collecting, organizing, examining, and interpreting financial information to identify patterns, measure performance, and support business decisions.
It helps organizations understand their financial position by examining information such as:
-
Revenue and sales performance.
-
Business expenses and operating costs.
-
Cash flow and working capital.
-
Profits, losses, and profit margins.
-
Customer payments and outstanding invoices.
-
Investment performance and financial risks.
-
Budgets and financial forecasts.
For example, a retail business may notice that its revenue is increasing while its profits remain unchanged. Financial analytics can help management investigate whether higher product costs, employee expenses, discounts, or delivery charges are reducing profitability.
Rather than making decisions based on assumptions, managers can use actual financial information to understand the reasons behind the results.
In simple terms, financial data analytics helps answer three important questions: What happened financially? Why did it happen? What should the business do next?
How Does Financial Data Analytics Work?
Financial data analytics follows a structured process. Although the technology and methods may differ between organizations, the main stages generally remain similar.
1. Collecting Financial Data
The first step is gathering information from different financial sources. These may include accounting software, banking records, payment platforms, customer relationship management systems, enterprise resource planning software, and sales databases.
For example, an online store may collect transaction details, refunds, advertising expenses, inventory costs, and payment records.
The quality of the analysis depends heavily on the accuracy and completeness of this information.
2. Cleaning and Organizing Information
Financial records may contain duplicate transactions, missing values, inconsistent dates, or incorrect classifications. These problems can produce misleading results if they are not addressed.
Data cleaning involves identifying errors, standardizing formats, checking unusual entries, and organizing information into a consistent structure.
Businesses should also establish clear rules for handling financial records so that different departments use the same definitions and reporting methods.
3. Analyzing Financial Information
Once the information is organized, analysts examine it to identify trends, relationships, differences, and unusual activities.
They may compare monthly revenue, calculate profit margins, examine spending patterns, or measure actual performance against financial targets.
Different analytical methods can be used depending on the business question.
4. Creating Reports and Visualizations
Charts, dashboards, and financial reports make complex information easier to understand.
For example, a dashboard might display monthly revenue, expenses, net profit, cash flow, and outstanding customer payments in one place.
These visual reports help business owners and financial managers identify important changes without reviewing hundreds of individual transactions.
5. Making Informed Decisions
The final stage is using the findings to take practical action.
A company may reduce unnecessary expenses, change its pricing strategy, improve invoice collection, adjust inventory levels, or revise its financial forecast.
The purpose is not simply to produce reports. It is to use financial insights to improve business performance.
Types of Financial Data Analytics
Businesses use different types of analytics depending on the financial questions they want to answer. Four major categories are commonly used.
1. Descriptive Analytics
Descriptive analytics examines historical financial information to explain what has already happened.
For example, a company may review its monthly revenue, operating expenses, cash flow, and profit margins to understand its financial performance over the previous year.
It is particularly useful for financial reporting, monthly reviews, performance measurement, and identifying historical trends.
2. Diagnostic Analytics
Diagnostic analytics focuses on understanding why a particular financial result occurred.
Suppose a business experiences a sudden decrease in monthly profits. Diagnostic analysis can help identify whether the problem came from declining sales, higher supplier prices, increased advertising expenses, or reduced customer demand.
It helps managers investigate the reasons behind financial changes instead of simply observing the numbers.
3. Predictive Analytics
Predictive analytics uses historical information, statistical techniques, and forecasting models to estimate possible future outcomes.
Businesses can use it to forecast revenue, estimate future expenses, predict cash flow requirements, and assess potential financial risks.
For example, a company can examine previous seasonal sales patterns to estimate how much revenue it might generate during the next holiday season. However, predictions are estimates, not guaranteed results.
4. Prescriptive Analytics
Prescriptive analytics goes a step further by helping organizations evaluate possible actions.
For example, a business may compare different pricing strategies, advertising budgets, or investment options to understand which approach could produce better financial results.
It can also use optimization techniques to evaluate resource allocation under specific business constraints.
Together, these four types provide a more complete understanding of financial performance, from reviewing past results to evaluating future decisions.
Major Benefits of Financial Data Analytics
Financial analytics offers practical advantages for businesses, financial departments, investors, and organizations that need reliable information to manage their resources.
1. Better Financial Decision-Making
One of the biggest advantages is the ability to make decisions using evidence rather than assumptions.
Business owners can examine actual revenue, costs, profit margins, and cash flow before deciding whether to hire employees, purchase equipment, expand operations, or introduce new products.
For example, if sales are increasing but operating costs are growing faster, management can investigate the problem before approving additional spending.
2. Improved Budgeting and Financial Planning
Traditional budgeting often depends on previous financial results and management estimates. Analytics makes this process more detailed by examining spending patterns, seasonal changes, business growth, and unexpected expenses.
Finance teams can compare actual spending with approved budgets and identify areas where costs are exceeding expectations.
This allows businesses to adjust financial plans earlier instead of waiting until the end of the year.
3. Stronger Cash Flow Management
A profitable business can still experience financial difficulties if customers pay late or expenses become due before sufficient cash is available.
Financial data analytics helps organizations monitor incoming payments, outgoing expenses, outstanding invoices, and expected cash requirements.
For instance, a company may identify that several large customers regularly pay invoices after the agreed payment date. Management can use this information to improve payment reminders, review credit terms, or plan additional working capital.
4. Cost Reduction and Profitability
Analytics helps businesses understand where their money goes and which expenses contribute to unnecessary financial pressure.
By comparing costs across departments, products, suppliers, and locations, organizations can identify expensive processes and opportunities for improvement.
For example, a manufacturing company may discover that one production line consumes significantly more materials than similar operations. Investigating the difference could reveal waste, maintenance problems, or inefficient purchasing practices.
5. Early Identification of Financial Risks
Financial analytics can help organizations identify unusual transactions, increasing debt levels, declining revenue, delayed payments, and unexpected spending.
These warning signs allow management to investigate potential problems before they become more serious.
Financial institutions can also use analytical models to support credit assessments, transaction monitoring, and risk management.
However, analytical alerts should be investigated carefully because unusual activity does not automatically mean fraud or financial misconduct.
6. Faster and More Accurate Reporting
Preparing financial reports manually can take considerable time, particularly when information comes from multiple departments.
Analytics platforms can help automate data collection, calculations, reporting, and dashboard updates.
This reduces repetitive work and gives financial teams more time to interpret results, review unusual figures, and support strategic planning.
7. Better Business Forecasting
Businesses operate in changing markets where customer demand, supplier prices, interest rates, and operating expenses can affect financial performance.
Financial analytics helps companies examine different scenarios and prepare for possible changes.
For example, management can estimate how a 10% increase in material costs might affect product prices and profit margins. Such scenario analysis supports more informed planning.
Best Financial Data Analytics Tools
Choosing the right software depends on business size, data volume, technical skills, reporting requirements, and budget.
Some organizations need simple spreadsheet analysis, while others require advanced databases, statistical models, and interactive reporting platforms.
Here are several widely used tools.
1. Microsoft Excel
Excel is a practical starting point for financial analysis. It supports formulas, PivotTables, charts, financial models, and budget tracking. Power Query can also help import, combine, and prepare financial information.
Best for: Small businesses, accountants, budgeting, and spreadsheet-based analysis.
2. Microsoft Power BI
Power BI helps businesses connect financial data sources, create interactive dashboards, build reports, and share insights across teams. It is useful for monitoring financial performance through visual reports.
Best for: Business intelligence, financial dashboards, and management reporting.
3. Tableau
Tableau is a data visualization and business intelligence platform. It helps analysts explore financial information through interactive charts, dashboards, and visual reports.
Best for: Visual financial reporting and exploring complex datasets.
4. Python
Python is a programming language widely used for data analysis, automation, statistical modeling, and machine learning. Libraries such as pandas, NumPy, and scikit-learn support different analytical tasks.
Best for: Advanced financial modeling, automation, forecasting, and large datasets.
5. SQL
SQL allows analysts to retrieve, filter, combine, and organize information stored in relational databases. It is particularly helpful when financial records are spread across large databases.
Best for: Database analysis, transaction records, and financial data extraction.
R is designed for statistical computing, data visualization, and advanced analytical work. Financial researchers and analysts can use it to examine trends, build statistical models, and study investment-related information.
Best for: Statistical analysis, financial research, and quantitative modeling.
No single tool is suitable for every organization. A small company may manage its financial analysis with Excel, while a larger organization might combine SQL, Python, and Power BI to handle more complex requirements.
Business Applications of Financial Data Analytics
Financial analytics is not limited to accounting departments. It can support decisions across different business functions and industries.
1. Banking and Financial Services
Banks and financial institutions analyze transaction records, customer information, loan histories, and repayment patterns.
These insights can support credit risk assessment, fraud detection, customer segmentation, and regulatory reporting.
For example, a lending institution can examine a customer’s financial history and repayment behavior when evaluating a loan application. The final decision should also follow applicable lending rules and appropriate human oversight.
2. Retail and E-Commerce
Retailers use financial analytics to understand product profitability, sales performance, inventory costs, and customer purchasing behavior.
An online store can compare the revenue generated by different products with advertising, shipping, payment processing, and return costs.
This helps management identify which products generate sustainable profits rather than focusing only on sales volume.
3. Manufacturing
Manufacturing companies deal with raw material expenses, labor costs, equipment maintenance, inventory, and production efficiency.
Financial analytics can compare production costs across facilities and product lines. It can also help estimate how changing supplier prices or production volumes may affect profitability.
These insights support better purchasing decisions and cost management.
4. Healthcare Organizations
Hospitals, clinics, and healthcare providers use financial analysis to monitor operational budgets, staffing expenses, equipment costs, and revenue collection.
For example, a healthcare organization may analyze department-level spending to understand why certain services regularly exceed their budgets.
Financial analysis should be handled with appropriate privacy protections, especially when financial information is connected to patient records.
5. Investment and Asset Management
Investment professionals analyze historical prices, company financial statements, portfolio performance, market trends, and risk exposure.
Analytics can help compare investment alternatives, evaluate portfolio diversification, and understand how different market conditions could affect returns.
However, historical performance and predictive models cannot guarantee future investment results.
6. Small Business Financial Management
Small businesses can use financial analytics without investing in expensive enterprise systems.
A local shop, digital agency, or online business can track monthly revenue, customer payments, supplier expenses, and operating costs using spreadsheets or affordable accounting platforms.
For example, a digital marketing agency may analyze project revenue against employee hours and software expenses to determine which services generate the strongest profit margins.
This information helps the owner make better decisions about pricing, staffing, and business growth.
The Role of Artificial Intelligence in Financial Data Analytics
Artificial intelligence (AI) and machine learning are expanding the possibilities of financial analytics. Businesses can now use advanced analytical systems to process large amounts of information, recognize patterns, and support financial planning.
Some important applications include:
Automated Financial Reporting
AI-powered systems can assist with organizing financial records, identifying differences between accounts, and preparing reporting summaries.
This can reduce repetitive administrative work and allow finance professionals to focus more on reviewing results and making decisions.
Fraud Detection and Unusual Activity Monitoring
Machine learning models can examine transaction patterns and identify activities that differ from normal behavior.
For example, if a payment system detects unusual transaction frequency or unexpected spending patterns, it can flag the activity for further investigation.
Financial Forecasting
AI can analyze historical revenue, expenses, seasonal trends, and other relevant information to support financial forecasts.
Companies can use these forecasts to estimate future cash requirements, prepare budgets, and evaluate different business scenarios.
Intelligent Financial Planning
AI-assisted analytics can help businesses compare financial scenarios, evaluate spending patterns, and identify potential opportunities to improve efficiency.
However, AI-generated insights should not replace professional judgment. Financial data may contain errors, and predictive models can produce inaccurate results when market conditions change.
How to Implement Financial Data Analytics in a Business
Businesses do not need to transform their entire financial department immediately. A gradual approach can make implementation more manageable.
Step 1: Identify Business Goals
Start by identifying the financial problems that need attention.
For example, a business might want to improve cash flow, reduce operating expenses, increase profit margins, or make its budgeting process more accurate.
Clear objectives help determine what information needs to be collected and analyzed.
Step 2: Gather Data From Reliable Sources
Collect relevant financial information from accounting systems, sales platforms, banking records, invoices, and other business applications.
Make sure the information is accurate, consistent, and relevant to the objectives.
Step 3: Select Suitable Analytics Tools
Choose software according to your requirements and available resources.
A small business might begin with Excel, while an organization with larger datasets may benefit from SQL databases and business intelligence platforms.
Avoid purchasing complicated software before understanding what your business actually needs.
Step 4: Create Meaningful Financial Reports
Develop reports that focus on important financial performance indicators.
Useful measurements include:
-
Revenue growth: Measures how sales income changes over time.
-
Net profit margin: Shows the percentage of revenue remaining after expenses.
-
Operating expenses: Tracks the costs of running the business.
-
Current ratio: Helps assess short-term liquidity.
-
Accounts receivable: Measures money customers still owe.
-
Cash flow: Tracks money entering and leaving the business.
These indicators should be selected according to the organization’s industry and financial objectives.
Step 5: Review Results and Take Action
Financial analytics should become part of regular business management.
Review reports monthly or weekly, investigate unexpected changes, and compare actual performance with planned targets.
Management should also check whether decisions based on analytical findings are producing the expected improvements.
Challenges and Limitations of Financial Data Analytics
Although financial analytics provides valuable opportunities, businesses should understand its limitations before relying heavily on analytical systems.
Poor Data Quality
Incorrect, incomplete, or outdated information can produce misleading results. Even sophisticated analytical software cannot automatically correct every problem in the underlying financial records.
Businesses need consistent data collection, regular validation, and clear accounting procedures.
Data Security and Privacy
Financial information often includes confidential business records, employee details, customer information, and banking data.
Organizations should use access controls, encryption, secure storage, and appropriate data protection policies to reduce the risk of unauthorized access.
High Implementation Costs
Advanced analytics platforms may require software subscriptions, infrastructure, integration work, and specialist employees.
Smaller organizations should evaluate the expected benefits before investing in expensive systems.
Shortage of Analytical Skills
Understanding financial information requires more than knowing how to operate software.
Employees need knowledge of accounting, statistics, data interpretation, and business operations. Training and collaboration between finance and technology teams can help address this challenge.
Overdependence on Automated Predictions
Forecasting models rely on historical information and assumptions. Unexpected economic events, market changes, supply disruptions, and customer behavior can make previous patterns less reliable.
Businesses should treat analytical predictions as decision-support information rather than guaranteed outcomes.
Future Trends in Financial Data Analytics
Financial analytics will continue developing as organizations adopt more advanced technologies and improve how they manage information.
Several trends are particularly important.
1. AI-powered financial analysis: More finance teams are exploring AI to support reporting, forecasting, financial modeling, and routine analysis.
2. Real-time financial dashboards: Businesses increasingly want timely visibility into revenue, expenses, transactions, and cash positions rather than waiting for monthly reports.
3. Predictive financial planning: Companies are using statistical methods and machine learning to evaluate possible financial outcomes and prepare for uncertainty.
4. Cloud-based analytics: Cloud platforms can help organizations access analytical tools, connect different data sources, and collaborate across departments.
5. Stronger data governance: As financial systems become more connected, organizations need better controls over data quality, access, accuracy, and responsible use.
A July 2026 report from ACCA and CA ANZ also highlights the importance of addressing data and skills gaps as finance teams develop their use of AI and analytical technologies.
These developments suggest that future finance professionals will need a combination of financial knowledge, technology skills, and critical thinking.
Conclusion
Financial data analytics has become an important part of modern business management. It helps organizations turn financial records into meaningful insights that support budgeting, forecasting, cost control, risk management, and long-term planning.
With tools such as Excel, Power BI, Tableau, Python, and SQL, businesses can analyze financial information more efficiently and understand their performance from different perspectives.
However, successful analytics requires more than advanced software. Accurate information, appropriate security controls, skilled professionals, and clear business objectives are equally important.
Whether managing a small business or a large organization, starting with reliable financial records and a few meaningful performance indicators can create a strong foundation. As analytical capabilities improve, businesses that use financial information responsibly will be better prepared to understand challenges, identify opportunities, and make informed decisions.
FAQs
1. What is financial data analytics used for?
Financial data analytics is used to examine financial information, understand business performance, improve budgeting, forecast cash flow, manage risks, identify unusual transactions, and support better financial decisions.
2. Which tools are best for financial data analytics?
Popular tools include Microsoft Excel, Power BI, Tableau, Python, SQL, and R. The best choice depends on the organization’s size, analytical requirements, technical skills, and budget.
3. Is financial data analytics useful for small businesses?
Yes. Small businesses can use simple spreadsheets and accounting software to monitor income, expenses, cash flow, outstanding payments, and profitability. Even basic analysis can help owners make better financial decisions.
4. What skills are needed for financial data analytics?
Important skills include financial knowledge, accounting fundamentals, Excel, SQL, data visualization, statistics, analytical thinking, and communication. Advanced roles may also require Python, R, and machine learning knowledge.
5. What is the difference between financial analytics and financial reporting?
Financial reporting mainly presents financial information about an organization’s performance and position. Financial analytics goes further by examining that information to identify patterns, understand problems, forecast possible outcomes, and support decisions.